Real Estate Client Overview
A young real estate firm in Chennai, India which offers property in majorly 6 areas. Client hired us to analyse the existing data for last 11 years and help them with key insights to improve sales performance.
Data Description:
Data source: Extracted from Excel data sheet using Power BI
Time period of analysis: 16 January 2011 to 17 February 2022
Data size: Data consists of 22 columns with information like Area, Sales date, Sales price, Build date, Commission, Registration fee, etc.
Ready to harness the power of data for your real estate business? Contact Venturesathi for personalized insights.
Challenges:
- Navigating Data Extraction and Transformation: The client encountered challenges while extracting data from Excel sheets using Power BI and ensuring its accuracy, completeness, and suitability for analysis due to potential formatting inconsistencies and data quality issues.
- Handling Data Volume and Complexity: Managing and analysing data spanning over 11 years with 22 columns containing diverse attributes posed challenges for the client, requiring careful data management to avoid performance issues and extract meaningful insights.
- Deciphering Market Trends: Interpreting and uncovering market trends from the extensive dataset presented difficulties for the client, as it involved understanding complex factors influencing the real estate landscape, such as economic conditions, infrastructure development, buyer preferences, and competitive forces.
- Segmenting and Analysing Data: The client faced challenges in effectively segmenting the data into meaningful categories (e.g., areas, property types) and conducting comprehensive analysis within each segment, demanding strategic planning to derive accurate and actionable insights.
Facing similar challenges? Let Venturesathi transform obstacles into opportunities. Get in touch for expert guidance.
Project Objectives:
- Identify Market Trends: The analysis helps identify and understand market trends, such as demand patterns, pricing dynamics, and customer preferences. It enables client to make data-driven decisions and adapt their strategies to meet market demands.
- Measure Sales Performance: The primary objective is to measure and evaluate the sales performance of the client. This includes assessing key metrics such as sales volume, conversion rates, average sales price, days on market, etc.
- Identify Areas for Improvement: The analysis aims to identify strengths and weaknesses in the sales process and identify areas for improvement. It helps pinpoint bottlenecks, inefficiencies, or gaps in the sales cycle that can be addressed to enhance overall performance.
- Inform Decision-making: The analysis aims to provide actionable insights that inform decision-making. It helps real estate professionals make informed choices regarding pricing, marketing strategies, target demographics, and resource allocation to optimize sales performance.
- Set Performance Goals: A sales performance analysis helps set realistic and measurable performance goals for the real estate team or individual agents. It provides a basis for establishing targets and benchmarks for improvement and growth.
Ready to set ambitious performance goals for your real estate business? Partner with Venturesathi for strategic growth.
Analysis and insights
- The client has a presence in seven areas of Chennai, which is one of the top cities with a growing real estate market. We did a sales performance analysis and the observed trends in the data can be attributed to a combination of various factors, including market conditions, infrastructure development, location attractiveness, buyer preferences, economic factors, and changing demographics. By understanding these reasons client can make informed decisions, identify opportunities, and tailor their strategies to meet the evolving demands of the real estate market.
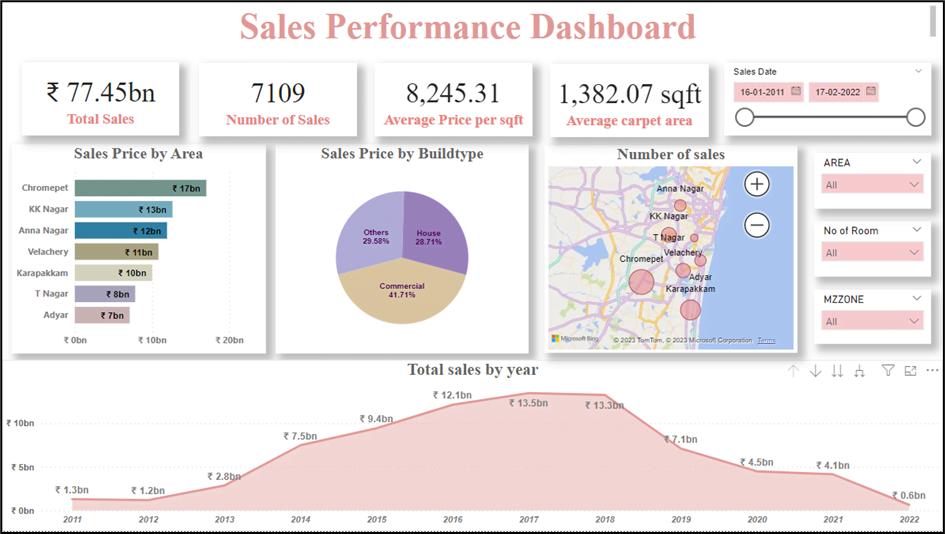
- During 2011-2012, property sales were limited to the Velachery area. This suggests that the client market was primarily focused on this locality during that period. The reason for this is attributed to factors such as the availability of attractive properties, infrastructure development, proximity to amenities, or specific market conditions that made Velachery a preferred choice for buyers.
- From 2013 to 2019, there was an expansion in property sales across all areas. This indicates a broader market growth and increased demand for real estate properties in various locations. The reason for this expansion is attributed to economic growth, improved consumer confidence, favourable lending conditions, urban development initiatives, or increasing population and migration patterns.
- In the years 2020-2022, property sales were concentrated in specific areas, namely Anna Nagar, Chromepet, and T Nagar. This suggests a shift in buyer preferences or market dynamics during this period. Potential reasons for this concentration are the emergence of these areas as attractive residential or commercial hubs due to factors like infrastructure development, accessibility, amenities, or evolving market trends and preferences.
- Chromepet stood out as the area with the highest number of property sales throughout the ten-year period. This indicates that Chromepet has been a popular and sought-after location for real estate investments. The reasons for Chromepet’s popularity include its strategic location, affordability, infrastructure development, connectivity, availability of amenities, and growing employment opportunities in the area.
- There was an overall increase in sales from 2014 to 2018, highlighting a period of market growth and high demand for properties. This growth is attributed to factors such as a strong economy, favourable market conditions, low-interest rates, increasing urbanization, and a growing population.
- The data reveals that house with 3 to 4 rooms were the most popular among buyers. Additionally, during 2015-2019, houses with 6 rooms were only available in KK Nagar. This information provides insights into the buyer preferences for specific room configurations and the limited availability of larger properties in certain areas. The popularity of houses with 3 to 4 rooms is due to the preferences of families or individuals seeking comfortable living spaces, while the limited availability of houses with 6 rooms in KK Nagar is influenced by factors like land availability, zoning regulations, and the local market demand.
- Commercial buildings recorded the highest number of sales over the fifteen-year period compared to houses and other property types. This suggests a robust demand for commercial spaces and indicates potential opportunities for developers and investors in the commercial real estate sector. The demand for commercial spaces is driven by factors such as economic growth, business expansion, increasing entrepreneurship, favourable investment returns, or the development of commercial hubs.
Unlock the potential of your data with Venturesathi. Consult our experts for tailor-made strategies.
Area wise analysis:
The data encompasses seven prominent areas of Chennai, namely Adyar, Anna Nagar, Chromepet, Karapakkam, Velachery, KK Nagar, and T Nagar. These areas are recognized as significant hubs within the city’s real estate market, each having its own unique characteristics and appeal. By analysing the sales performance in these areas, we can gain valuable insights into the dynamics of the Chennai real estate market and identify trends and patterns specific to each location.
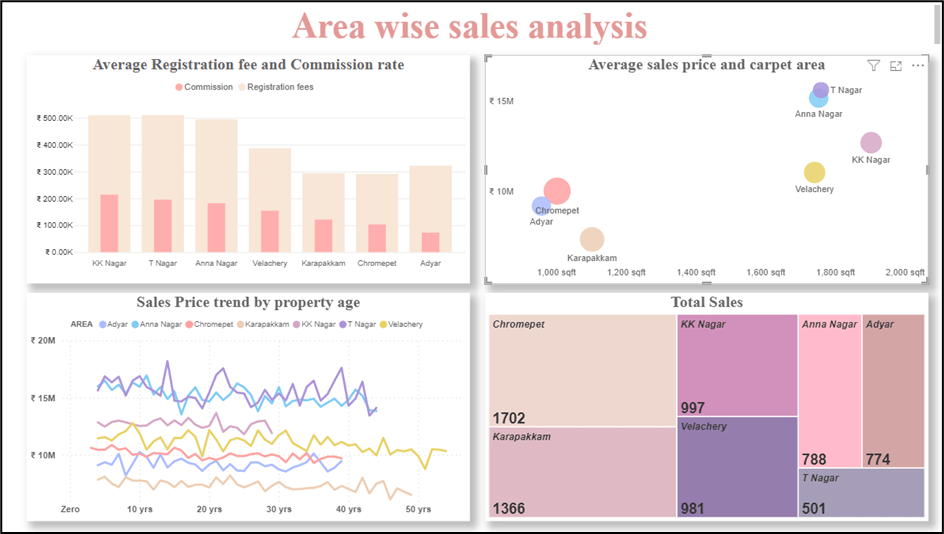
- T Nagar has the highest registration fees, indicating that property transactions in this area involve higher costs and government charges. On the other hand, Chromepet has the lowest registration fees, suggesting that property transactions in this area may be relatively more affordable for buyers. The variances in registration fees are attributed to factors such as property values, local regulations, and government policies.
- KK Nagar has the highest commission rates, indicating that real estate agents or brokers operating in this area charge higher fees for their services. Conversely, Adyar has the lowest commission rates, suggesting that real estate transactions in this area involve lower agent commissions. The differences in commission rates are influenced by factors such as market competition, agent expertise, and negotiation practices.
- The areas of Anna Nagar and T Nagar have the highest average sales prices, indicating that properties in these locations command higher market values. This is attributed to factors such as desirable neighbourhoods, proximity to amenities, and perceived value associated with these areas. On the other hand, Karapakkam has the lowest average sales price, suggesting that properties in this area is more affordable for buyers.
- Chromepet and Adyar have the smallest average sqft area for properties, indicating that homes in these areas are generally more compact or have smaller living spaces. In contrast, KK Nagar has the largest average sqft area, suggesting that properties in this area offer more spacious living arrangements. The variations in sqft area are influenced by factors such as land availability, construction practices, and market demand for different property sizes.
- Velachery and Karapakkam have longer “Days on Market,” indicating that properties in these areas take more time to sell after construction or listing. This is due to factors such as market demand, property pricing, competition, or specific characteristics of the local real estate market. On the other hand, KK Nagar has the shortest “Days on Market,” suggesting that properties in this area tend to sell relatively quickly, possibly due to high demand and favourable market conditions.
Curious about the potential in specific areas? Talk to Venturesathi for insights that drive growth.
Property Sales analysis:
Analysing the provided data reveals key insights into the real estate market trends and dynamics across different areas in Chennai. Let’s explore the observations in more detail to gain a comprehensive understanding of the market landscape.
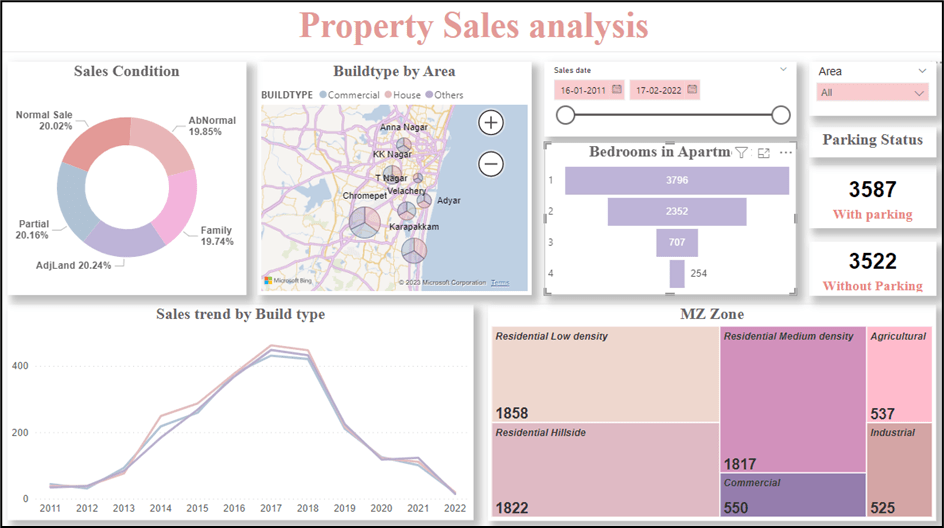
- Number of Houses with and without parking indicates that all areas have a similar distribution of properties with parking and without parking. This suggests that the availability and demand for parking spaces are relatively consistent across the analysed areas.
- Adyar, Karapakkam, and Velachery have a mix of agricultural, commercial, and industrial zones, indicating the presence of diverse land uses in these areas. Residential hillside, residential low density, and residential medium density zones are common across all seven areas, emphasizing the predominance of residential properties.
- In Adyar, Anna Nagar, Chromepet, and Karapakkam, properties with 1 and 2 bedrooms are available, with a higher number of sales for 1-bedroom properties. This is attributed to factors such as affordability, market demand for smaller homes, and the target demographic in these areas.
- Adyar experienced sales during 2013-2019, with the highest sales of house buildings in 2017, which declined in 2019. This is influenced by factors such as market conditions, property availability, and buyer preferences during those specific years.
- Both Anna Nagar and Chromepet witnessed sales during 2013-2022, with the highest sales of house buildings in 2013, which decreased to the lowest in 2015. These fluctuations are attributed to market dynamics, changes in buyer preferences, and the availability of properties in those years.
- Karapakkam had sales during 2016-2019, with the lowest sales of house buildings in 2016, followed by an increase in sales during 2017-2019. This is due to various factors such as market demand, property availability, and specific developments or projects in the area.
- T Nagar had sales during 2015-2022, while Velachery had sales during 2013-2022. Both areas experienced potential growth in commercial buildings during 2013-2014, which declined to the lowest level in 2015. This is influenced by factors such as market demand, economic conditions, and changes in the commercial real estate landscape.
Explore a comprehensive analysis of property sales, identifying patterns, buyer preferences, and potential growth areas. Tailor your strategy based on data-driven insights.
Ready to tailor your strategy for success? Connect with Venturesathi and take the first step towards data-driven growth.
Inference from the case study
Based on the analysis of the provided data, we can make the following recommendations for the client:
- Diversify Market Presence: While the client has a presence in seven areas, it would be beneficial to consider expanding into other emerging areas of Chennai’s real estate market. By diversifying their market presence, the client can tap into new growth opportunities and capitalize on the potential of different locations.
- Focus on High-Demand Property Types: The data indicates that houses with 3 to 4 rooms are the most popular among buyers. Therefore, the client should consider prioritizing the development or acquisition of properties with these room configurations to cater to the demand of the majority of buyers. Additionally, given the limited availability of houses with 6 rooms in certain areas, exploring opportunities to provide larger properties in those locations could attract buyers seeking more spacious living arrangements.
- Evaluate Pricing Strategies: It is essential for the client to carefully analyse the average sales prices in each area and align their pricing strategies accordingly. Areas like Anna Nagar and T Nagar command higher prices, so the client should consider adjusting their pricing to reflect the market values accurately. Similarly, in the more affordable areas like Karapakkam, the client could explore pricing strategies that attract price-sensitive buyers.
- Consider Commercial Real Estate Investments: Commercial buildings have consistently recorded the highest number of sales over the fifteen-year period. This indicates a strong demand for commercial spaces in Chennai.
- Consider Targeting Different Buyer Segments: The data highlights variations in buyer preferences across different areas. By understanding the demographics and preferences of potential buyers in each area, the client can tailor their marketing and sales efforts to target specific buyer segments effectively.
- Monitor Construction and Sales Cycles: The sales performance analysis indicates fluctuations in sales volumes over specific years in different areas. Understanding the timing of market peaks and lows can help the client optimize their inventory, marketing efforts, and pricing strategies to maximize sales and profitability.
By implementing these recommendations, the client can enhance their market position, capitalize on growth opportunities, and make strategic decisions that align with the evolving dynamics of Chennai’s real estate market.
Solutions
- Data Quality Assurance: Rigorous data validation and cleaning processes were employed to ensure data accuracy, address missing values, and standardize data formats to facilitate accurate analysis.
- Data Processing Optimization: Efficient data processing techniques were used to handle the large dataset and enhance analysis speed, such as data indexing and optimizing query performance within Power BI.
- Multifaceted Analysis: Advanced data visualization techniques and exploratory data analysis were applied to dissect and interpret complex market trends, combining quantitative insights with contextual understanding.
- Segmented Analysis: Data was segmented by areas and property types, allowing for focused analysis within each category and revealing nuanced trends specific to different regions and property preferences.
Results
- Market Trend Insights: By analysing the 11-year dataset, valuable insights into market trends, demand patterns, and factors driving real estate dynamics were revealed. This knowledge empowered the client to anticipate shifts and adapt strategies accordingly.
- Sales Performance Evaluation: Comprehensive evaluation of sales performance metrics such as sales volume, conversion rates, and average sales price provided a clear understanding of the client’s performance strengths and areas needing improvement.
- Strategic Improvements: Identifying bottlenecks and inefficiencies in the sales process enabled the client to strategically address weaknesses, enhancing overall operational effectiveness and customer satisfaction.
- Data-Informed Decision-making: Actionable insights derived from the analysis guided pricing decisions, marketing strategies, target audience identification, and resource allocation, ensuring decisions were grounded in data rather than intuition.
- Performance Goals Definition: Informed by analysis, the establishment of realistic and measurable performance goals allowed the client to align their efforts with benchmarks, fostering growth and progress in the real estate business.
Ready to revolutionize your real estate strategy? Partner with Venturesathi’s Data Analytics Services today. Gain market insights, optimize sales, and propel your business forward. Contact Us for a tailored solution!