Client Profile:
One of our clients, a young ecommerce player who deals in consumer product such as Office supply, Office Furniture and technological consumables using its online platform. Our client intends to perform product performance analysis of its existing portfolio to improve their YTD/YOY sales growth and evaluate their product strength and weaknesses in existing and emerging markets.
Data Description:
Data source: Extracted from MySQL database of the E-Commerce store
Time period of analysis: 1st January 2022- 31st December 2022
Data Size: Data consists of 19 columns data, with details information like Sales, Profit, Discounts, State name, City name etc.
Project objectives:
- Identification and improvement of potential areas: Monitoring of product performance data can be implemented by firms to locate the areas where their products fall short of their original goals. The product or its methods of marketing can be upgraded with the use of this knowledge.
- Increasing revenue: Businesses can uncover possibilities to cut production costs, stabilizing discount on items or improve sales by analysing product performance data. This data can be utilized to make data-driven decisions that boost profitability.
- Product effectiveness: The goal of product effectiveness is to figure out a product’s success in attaining its primary goals and objectives. It provides valuable information into how well a product is functioning in the market and can assist organizations to pinpoint areas where the product’s performance can be improved.
- Competitive market: Businesses may find insights into how their service performs in relation to competitors in the market by reviewing product performance data. This data can be utilized to make vital adjustments to the product or its marketing strategies in order to remain competitive.
Challenges:
- Data Management: Gathering, cleaning, and organizing the data extracted from the MySQL database is challenging due to potential inconsistencies, missing values, or inaccuracies.
- Interpretation Complexity: Interpreting the significance of the data and connecting it to actionable insights is complex, especially when dealing with multiple variables and segments.
- Market Dynamics: Understanding the evolving market dynamics, consumer behaviour shifts, and competitive landscape to effectively strategize and optimize product offerings.
- Balancing Profit and Discounts: Finding the right balance between offering discounts to boost sales while maintaining healthy profit margins require careful analysis and decision-making.
Analysis and Insights:
- State wise Market revenue analysis
The client has a business reach in 47 US states with its products classified into three categories i.e., Office Supply, Furniture and Technology items. More than 70% of orders and sales revenue have been achieved from ten key states, thereby contributing to the overall net profit.
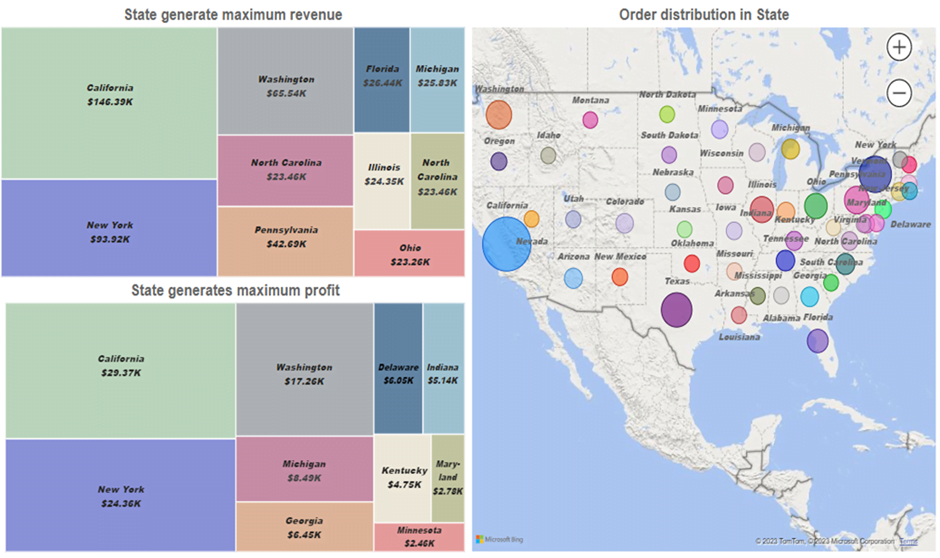
Figure-01
- Segment for product analysis
Understanding how well a product meets customer needs and expectations requires analysing the impact of consumers on product performance. Businesses can make informed decisions about how to improve their products and better meet the needs of their customers by learning usage patterns and taking demographic and sales data into account. Basically, the market is divided into three segments: Consumer, Home Office and Corporate. Here we try to analyse customer consumption in different States of US i.e., Segment to understand better market for products and their performances.
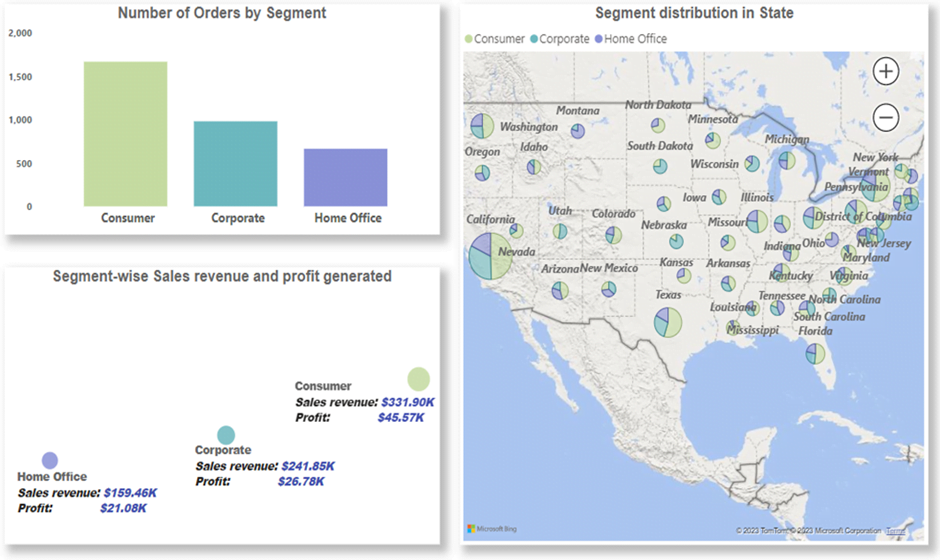
Figure-02
Consumer segment is the major area where most of the business are focussed on just like our clients, making most numbers of orders around 50.36% of all orders. The order patterns seems that consumer have diverse needs and preferences, where major portions want to invest more on enterprises and corporations, accounting 79% of orders from Office-Supplies and Technology categories.
Similarly, the other two sectors (Corporate and Home-Office) are primarily concerned with their business setup, investing more in technological and office-supply products and a smaller percentage on office-renovation (Furniture). Home Office has the fewest orders, accounting for 20% of total orders.
- Number of Orders for product analysis
Product performance tracking over time can assist in identifying patterns, changes, and trends that can provide significant insights for businesses. Time trends can assist businesses in identifying seasonal patterns in product performance, product lifecycle, product performance against competitors across time, and forecasting future product sales and demand.
Here we try to analyse pattern of product of orders made against days, quarterly basis of time trend.
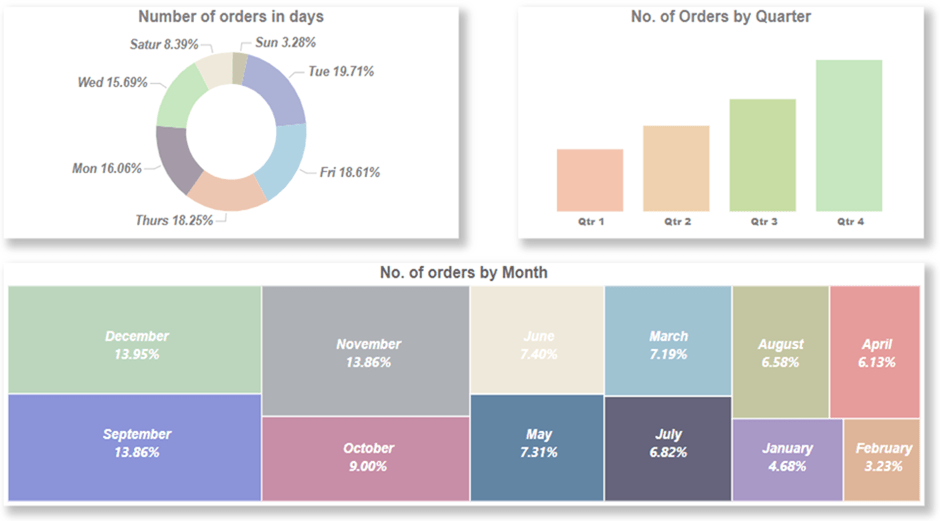
Figure-03
Most orders were placed between Monday and Friday, covers averagely 17.7% of total number of orders. The major reason behind this are the busy work schedules of consumers, business operational in weekdays and logistic service. Weekends had the fewest orders, and Sunday is the least popular day, only covers 3.80%.
With festive season like Christmas, Black Friday, Cyber Monday, and companies focus on launching new products, quarter 4 (October-December) is the biggest quarter for sales growth demand with 36.81% of total number of orders.
On the other hand, due to budgetary restrictions, seasonal variables, and consequences from the post-holiday season, Quarter 1 (January-March) typically experiences slower sales growth demand covering only 15.1% of total orders.
- Number of Orders for product analysis
The impact of product category and quantity sold on product performance analysis is substantial. Different product categories have varying levels of demand and profitability, and businesses can find which categories are most profitable by analysing the performance of each category and the quantity of products sold over time. It also assists in identifying trends and patterns that can be used to plan inventory and production strategies. Profitability and product discounts are important metrics in product performance analysis, especially in terms of sales volume and profitability. Businesses can boost demand and improve sales volume by offering discounts, but this may come at the expense of lower profit margins. Analysing the impact of discounts on product sales and profitability can assist firms in making informed decisions about when and how much to offer discounts to maximise overall profitability.
Here we try to analyse between category, product, sales, and discount on product items to gain useful insights that will allow them to make smart pricing, inventory, manufacturing, and marketing decisions.
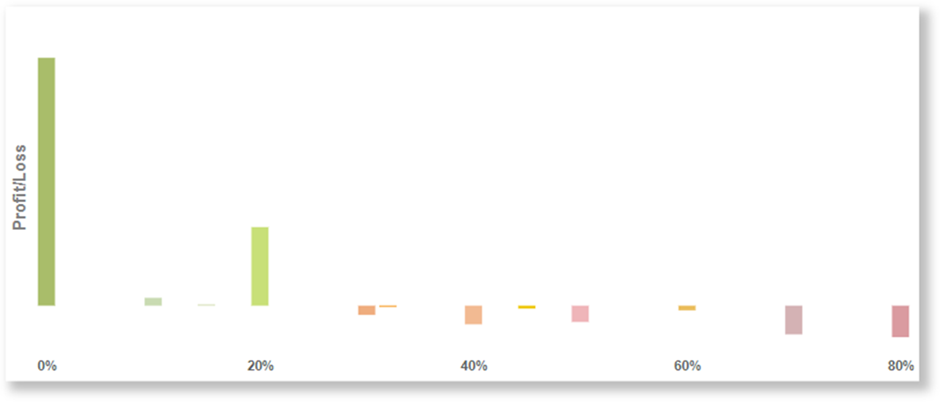
Figure-04
It is noticed that at a set value of subsidy from product item, i.e., 20% discounted from items, losses increase if more discounts are offered in it. Most of the items, approximately 86%, are in the profit category, while the remainder are in the loss group. Furniture is the least profitable category, with around 24% of items falling into the loss category, i.e., discounts ranging from 20% to 80%. With less than 9% of goods in the loss category, the Technology category outperforms all others in terms of profit earned.
Deeper analysis on discount, profit, loss, and Category wise products.
The discount granted on a specific group level product item and its reliance on product item profit and loss make it an impactful parameter to extract information such as price, inventory, production, and marketing strategies to maximise profitability.
In this section we endeavored to keep track of category-wise product items, their profit, and losses because of the discount offered on them.
- Office Supplies
The office supply market has seen increased competition from online retailers, resulting in a drop in demand for physical locations and traditional office supplies. To attract customers and remain competitive, some retailers have had to offer bigger discounts.
Another explanation could be evolving customer preferences, as many consumers are moving away from paper-based workflows and towards digital technology. Consolidation in the business could also have contributed to the discounting of office segment items. Several big office supply market competitors have merged or gone out of business, reducing competition, and increasing price power for the remaining companies. This could have resulted in additional discounting to shift extra inventory and remain competitive.

Figure-5(a)
The key profit components of the Office-Supplies category range from 0% to 20% discount. The Office-Supplies category covers 42.52% of total profit among all categories.
The principal loss components of the Office-Supplies category range from 70% to 80% discount. At a 10% discount, Office Supplies produce the least profit, indicating that items in the Office Supplies category are discounted less frequently. At 80% off, the Office Supplies item lost the most money.
- Furniture
Like office supply products, the demand for physical furniture items has decreased due to competition from online shops and changing consumer preferences.
Furthermore, the high costs of materials and labor for furniture manufacture make price competition with lower cost imported products challenging. Economic downturns and uncertainty, combined with a tendency towards smaller living spaces and a focus on simplicity, reduced consumer expenditure on furniture products.
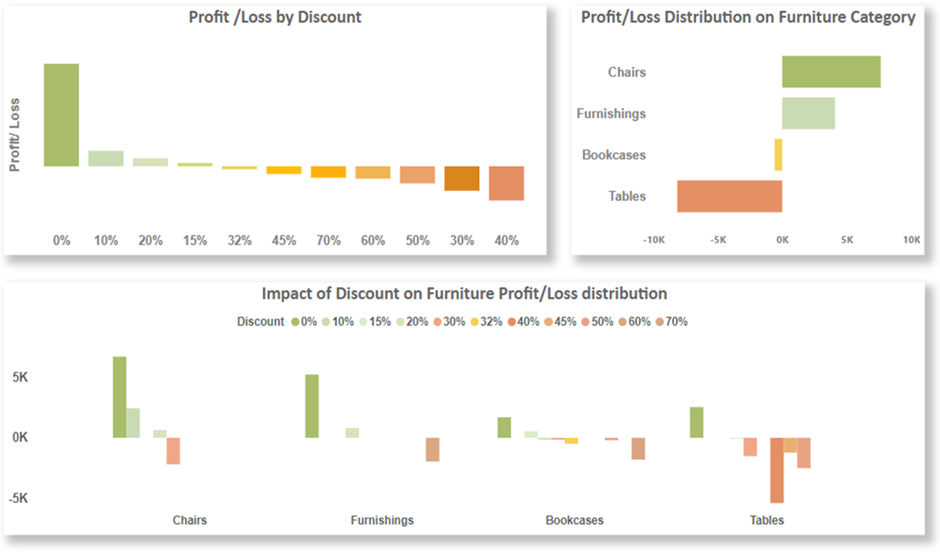
Figure-5(b)
The key profit components of the Furniture category range from 0% to 20% off, with a total profit value of 20530 US dollars. The overall loss in the Furniture category is around 17512 US dollars. The largest loss components of the Furniture category are at 40% discount, accounting for 31% of total loss values. Furniture makes the least profit with a 15% discount, indicating that items in the Furniture category are discounted less frequently than at a 10% discount.
- Technology
Technology items are consistently in great demand, notably personal computers, copiers, and other mobile gadgets. Digitalization has raised the need for technology items in both personal and professional settings. Because the technology industry is always growing and innovating, low-cost generating products enabled them to generate various streams of revenue and retain profitability even during economic downturns. Another explanation is that it has offered less discount even during poor sales periods. Companies rely on holiday sales like Black Friday and Cyber Monday to increase revenue, and they provide discounts to persuade customers to buy during these times.
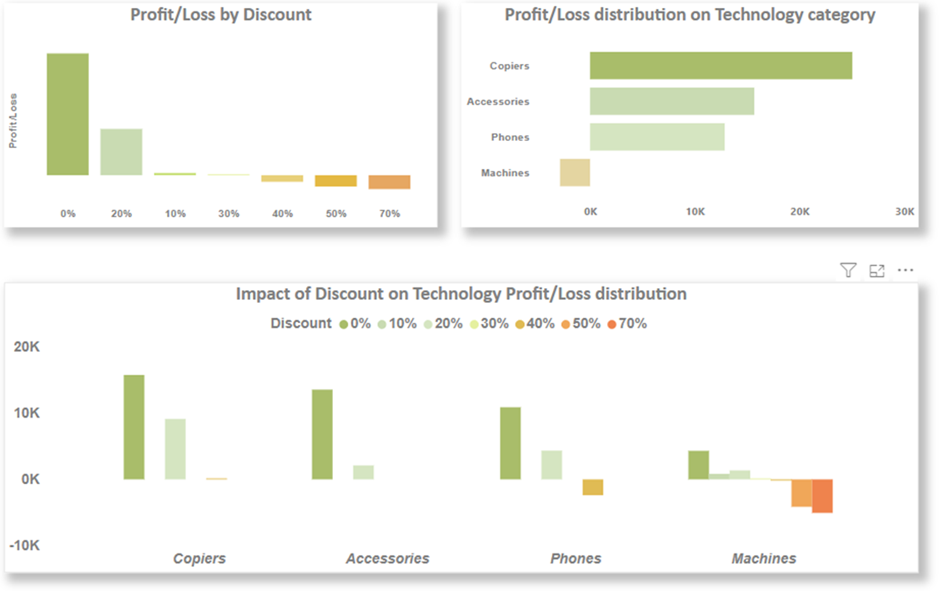
Figure-5(c)
The key profit components of the Technology category range from 0% to 20% off discount. The principal loss components of the Office-Supplies category range from 70% to 80% discount. At a 10% discount, Office Supplies produce the least profit, indicating that items in the Office Supplies category are discounted less frequently. At 80% off, the Office Supplies item lost the most money.
Inferences:
Based on the above findings, here are some of the recommendations made for the company’s future growth:
- Focus on key states: Focus resources and marketing efforts for major dominated states to maximise profitability. This can be identified from Top 10 revenue generated states. (Refer Figure-1)
- Cater to consumer segment: Prioritise understanding the consumer segment’s different demands and preferences. Invest in products that cater to enterprises and corporations within the Office Supplies and Technology categories. (Refer Figure-2)
- Capitalize on peak sales periods: Leverage the high demand during the fourth quarter. Plan marketing campaigns and new product launches to capitalize on these periods of increased sales growth. (Refer Figure-3)
- Optimize discount strategies: Offer discounts strategically to boost demand and improve sales volume, while considering the potential impact on profit margins. Find the optimal balance between discounts and profitability for each product category. (Refer Figure-4)
- Evaluate furniture category: Consider adjusting pricing, exploring cost-effective manufacturing options, and identify niche markets that align with changing consumer preferences. (Refer Figure-5(b))
Solutions:
- Data Preparation: Implementing data preprocessing techniques, such as data cleaning and transformation, to ensure the data is accurate and ready for analysis.
- Advanced Analytics Tools: Utilizing advanced analytics tools and techniques, such as data visualization and predictive modelling, to gain deeper insights from the complex dataset.
- Market Research: Conducting thorough market research to stay informed about market trends, customer preferences, and competitor strategies.
- Dynamic Pricing Strategy: Developing a dynamic pricing strategy that considers demand patterns, profit margins, and customer sensitivity to discounts.
Results:
- Enhanced Strategic Focus: By identifying key states and market segments contributing to significant revenue, the client strategically allocates resources and tailor marketing efforts.
- Targeted Product Strategy: Understanding consumer preferences in different segments allowed the client to tailor product offerings to meet specific demands, potentially increasing sales and customer satisfaction.
- Optimized Sales Periods: Leveraging peak sales periods led to increased sales growth during the fourth quarter, contributing to higher revenue and improved overall performance.
- Profitable Discounting: The analysis of discount strategies led to informed decisions on offering discounts, helping to boost sales volume without sacrificing profitability.
- Furniture Category Revamp: Insights into the challenges faced by the furniture category prompted considerations for pricing adjustments, manufacturing improvements, and exploring niche markets to enhance its profitability.