Client Overview
One of our clients is a tertiary care medical college and hospital located in Ludhiana, Punjab, India. Over a two-year period, they admitted 15,757 patients, including 12,244 unique individuals and 1,921 patients with multiple admissions. The hospital offers specialized medical services and plays a vital role in providing advanced care to a diverse patient population. They wanted to use their extensive dataset collected for valuable insights, contributing to evidence-based decision-making and improved healthcare strategies.
Data Description
Data source: Extractedfrom Excel data sheet using Power BI
Time period of analysis: 1 April 2021 to 31 March 2023
Data size: The data consists of 56 columns, specifically data is related to patients date of admission, date of discharge, demographics, such as age, gender, locality (rural or urban), type of admission (emergency or outpatient), patient history, including smoking, alcohol, diabetes mellitus (DM), hypertension (HTN), prior coronary artery disease (CAD), prior cardiomyopathy (CMP), and chronic kidney disease (CKD); and lab parameters corresponding to haemoglobin (HB), total lymphocyte count (TLC), platelets, glucose, urea, creatinine, etc. Other comorbidities and features (28 features), including heart failure, complete heart block, were recorded, and analysed.
Objective
- Patient Insights: To provides crucial insights into patient demographics, outcomes, and duration of stay, enabling informed decision-making and improved patient care.
- Comprehensive Diagnosis Overview: To provide an overview of the prevalence of medical conditions, risk factors, cardiovascular conditions, and trendlines of key parameters based on patient identification (id) and age. Comprehensive trendlines of key health parameters, allowing healthcare providers to monitor and analyse patient test results for informed decision-making and improved patient care.
- Disease-Specific Medical Test Analysis: To provides a comprehensive visual analysis of key medical tests, including creatinine, glucose, platelets, total leukocytes count, haemoglobin, and urea. The analysis is further categorized based on specific diseases such as cardiomyopathy, chronic kidney disease, coronary artery disease, diabetes mellitus, and hypertension. Additionally, the dashboard allows for filtering and analysis based on age groups.
Challenges
- Data Complexity and Volume: Dealing with a dataset consisting of 56 columns and spanning over two years presented challenges related to data management, storage, and processing. Ensuring data accuracy, completeness, and effective utilization was essential.
- Data Integration: Integrating data from diverse sources such as patient demographics, medical history, lab parameters, and comorbidities required meticulous data integration processes to create a comprehensive view of each patient’s health profile.
- Identifying Medical Trends: Gaining insights from complex medical data to identify prevailing trends, disease correlations, and potential risk factors demanded robust analytical techniques and expertise in medical data analysis.
- Visualization of Insights: Presenting complex medical data in a visual and easily understandable format for healthcare professionals required effective dashboard design and visualization techniques to ensure insights were readily accessible and actionable.
Analysis and Insights
Patient Analysis
Client recognized the need for a centralized and visual representation of patient admission data to enhance operational efficiency and monitor key metrics. We aimed to implement a comprehensive patient admission dashboard to facilitate data-driven decision-making and improve patient outcomes.
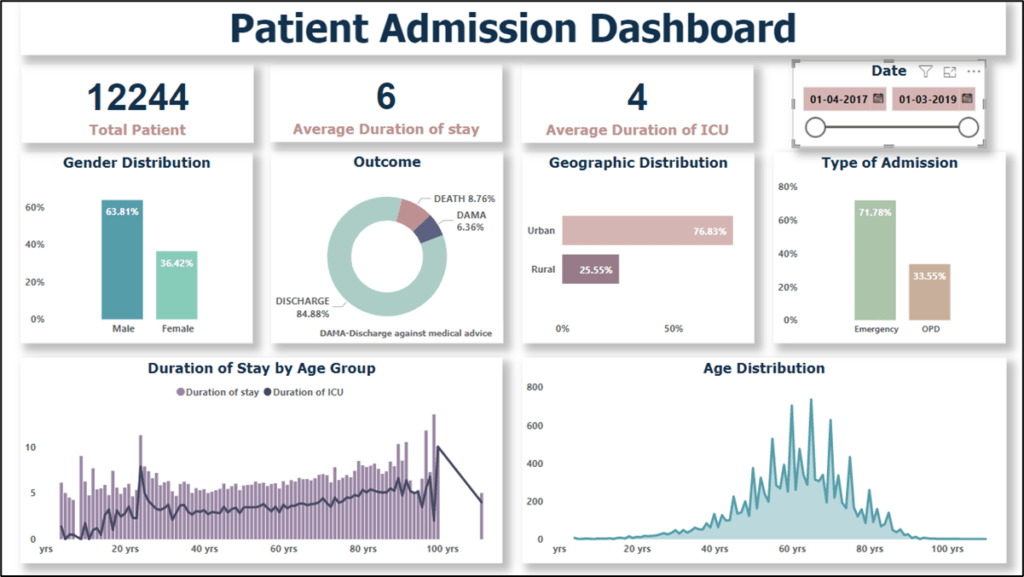
- The number of male patients is higher compared to female patients. This is due to the higher population of males and also various factors such as differences in healthcare-seeking behaviour, prevalence of specific health conditions.
- Among the admitted patients, a significant majority, approximately 84.88%, were discharged after receiving treatment. This indicates that the hospital’s healthcare interventions were successful in managing the patients’ conditions and facilitating their recovery. Only a small percentage, around 8.76%, experienced mortality, while the remaining were discharged against medical advice, which is due to various reasons such as personal choice, financial constraints, or seeking alternative treatments.
- The data suggests that urban patients represent a larger proportion compared to rural patients. This is due to factors such as better accessibility to healthcare facilities in urban areas, higher population density.
- The majority of patients were admitted during emergencies, constituting approximately 66.45% of the total admissions. This highlights the critical nature of the medical conditions that required immediate attention and hospitalization. Only 33.55% of patients were admitted as outpatients.
- The average duration of stay in the hospital for patients is approximately 6 days, indicating the need for comprehensive medical treatment and monitoring. Additionally, the average duration of stay in the intensive care unit (ICU) is around 4 days, suggesting that certain patients required specialized and intensive care due to the severity of their medical conditions.
- The age distribution of patients indicates that the majority fall within the age range of 50 years to 75 years. This is due to the higher prevalence of age-related health conditions, such as cardiovascular diseases, diabetes, and other chronic illnesses, which are more common in older adults. Additionally, the aging population in general require more medical attention and have a higher likelihood of hospitalization.
Patient Diagnosis Analysis
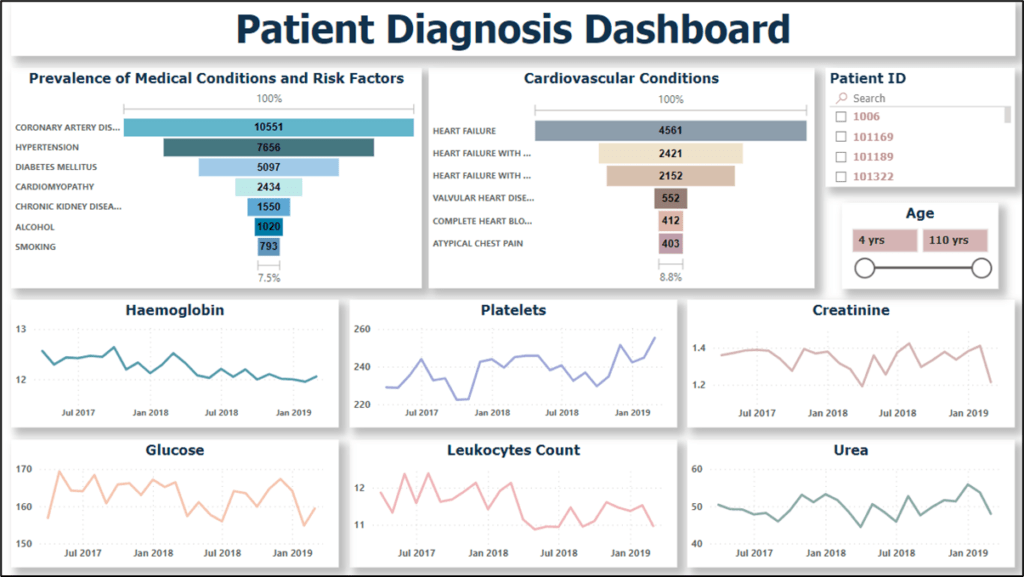
Client recognized the need to improve the diagnosis and management of various medical conditions, particularly cardiovascular conditions, by leveraging patient data and visual analytics. We aimed to implement a comprehensive dashboard that would provide insights into the prevalence of medical conditions, risk factors, and cardiovascular conditions, while allowing for personalized analysis based on patient ID and age. This dashboard will display trendlines of important health parameters over time, along with filtering options based on patient characteristics and outcomes.
- Among the patients admitted, coronary artery disease (CAD) has the highest prevalence at approximately 66%. This indicates a significant burden of cardiovascular disease in the patient population. Cad is due to unhealthy lifestyle habits, genetic predisposition, and age.
- Hypertension is the second highest condition among the admitted patients, with a prevalence of approximately 48%. Factors such as sedentary lifestyle, poor dietary habits, stress, and genetic causes hypertension.
- Diabetes mellitus has a prevalence of around 32% among the admitted patients. Uncontrolled diabetes led to various complications, including cardiovascular diseases. Risk factors such as obesity, sedentary lifestyle, unhealthy diet, and genetic factors contribute to the development of diabetes.
- Among the cardiovascular conditions, heart failure has the highest prevalence at approximately 28%. Heart failure is caused due to underlying heart conditions (such as CAD and hypertension), previous heart attacks, diabetes, and lifestyle factors like smoking and obesity.
- Over the course of the year, certain key parameters have shown specific trends. Haemoglobin, creatinine, total leukocyte count, and urea have shown a drop in their values. This indicates various factors such as ongoing treatments, disease progression, or medical interventions aimed at managing these parameters.
- On the other hand, glucose and platelet levels have shown an increase over time. Elevated glucose levels indicate the presence of diabetes or uncontrolled blood sugar levels. Platelet count can increase in response to inflammation, infection, or certain medical conditions.
These trends also require further investigation and medical intervention to address the underlying causes and ensure appropriate management of these parameters.
Disease-Specific Medical Test Analysis
Client recognized the need to identify trends and patterns in key medical tests across different diseases. We aimed to develop a dashboard that could effectively analyse and visualize the test results for better disease management and treatment planning. This dashboard would allow healthcare professionals to monitor and compare the test trends of various diseases and their impact on different age groups.
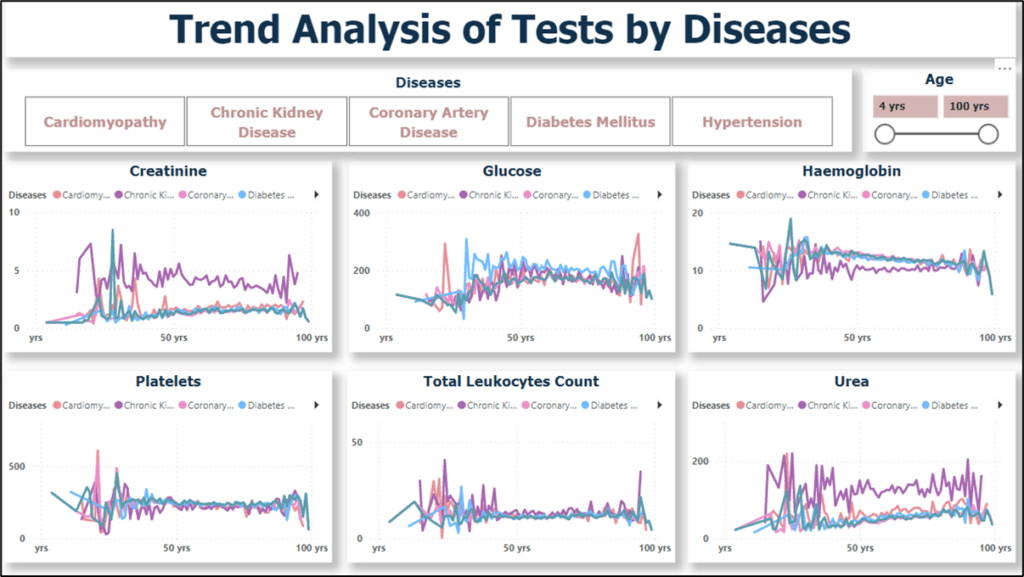
- Creatinine levels: Patients with Chronic Kidney Disease (CKD) tend to have higher creatinine levels, indicating impaired kidney function. On the other hand, patients with coronary artery disease (CAD) show lower creatinine levels. CKD is a progressive condition characterized by the gradual loss of kidney function, which can lead to the accumulation of creatinine in the blood. CAD, on the other hand, primarily affects the heart and does not directly impact creatinine levels.
- Glucose levels: Patients with Diabetes Mellitus show higher glucose levels compared to other conditions. This is because diabetes is characterized by high blood sugar levels resulting from insufficient insulin production or insulin resistance. In contrast, patients with CAD tend to have lower glucose levels. CAD primarily affects the blood vessels supplying the heart and does not directly impact glucose regulation.
- Haemoglobin levels: Hypertension is associated with higher haemoglobin levels, while patients with CKD tend to have lower haemoglobin levels. Hypertension is a condition characterized by high blood pressure, which can lead to increased red blood cell production and higher haemoglobin levels. CKD, on the other hand, can result in anaemia, leading to lower haemoglobin levels due to impaired kidney function.
- Platelet levels: Hypertension is associated with higher platelet levels, possibly due to increased platelet activation and aggregation, which are common in hypertensive patients. Conversely, patients with CKD tend to have lower platelet levels. CKD leads to platelet dysfunction and reduced platelet count due to the impact on the bone marrow and impaired production of platelets.
- Total leukocyte count: Patients with CKD tend to have higher total leukocyte counts, indicating increased inflammation or infection. In contrast, patients with CAD show lower leukocyte counts. CKD leads to chronic inflammation and compromise’s immune function, resulting in elevated leukocyte counts. CAD primarily affects the cardiovascular system and may not directly impact leukocyte counts.
- Urea levels: CKD patients typically have higher urea levels due to impaired kidney function and reduced ability to eliminate urea from the body. Conversely, patients with CAD tend to have lower urea levels, as CAD primarily affects the heart and blood vessels and does not directly impact urea levels.
Inference from the Case Study
- Prevalence of Cardiovascular Conditions: The analysis indicates a significant prevalence of cardiovascular conditions within the patient population, with coronary artery disease and hypertension being particularly prominent.
- Gender-Specific Healthcare Strategies: The higher proportion of male patients suggests a need for healthcare strategies that address gender-specific health concerns and encourage tailored medical interventions.
- Urban Patient Dominance: Urban patients constitute a larger portion of the admissions, likely due to better healthcare accessibility in urban areas. This emphasizes the importance of ensuring equitable access to healthcare services across different geographical regions.
- Emergency Admissions: The majority of admissions are for emergency cases. This underscores the importance of establishing efficient emergency care systems to address critical medical situations promptly and effectively.
Solutions
- Dashboard Development: Customized dashboards were created using Power BI to visualize patient demographics, admission types, and outcomes. This facilitated quick and informed decision-making by healthcare administrators.
- Trend Analysis: Advanced analytical tools were used to analyse trends in key medical parameters over time, aiding in identifying disease progression and response to treatments.
- Disease-Specific Analysis: Disease-specific dashboards were designed to analyse medical test results for conditions like CKD, CAD, diabetes, and hypertension. This provided insights into the relationships between medical parameters and specific diseases.
- Personalized Insights: The dashboards allowed filtering and analysis based on patient ID and age, providing personalized insights into patient health profiles and aiding in treatment planning.
Results
- Informed Decision-making: The visualized insights allowed healthcare administrators to make data-driven decisions for resource allocation, infrastructure improvement, and specialized care provision.
- Enhanced Patient Care: The trend analysis enabled healthcare professionals to closely monitor patients’ responses to treatment, leading to improved care strategies and patient outcomes.
- Targeted Disease Management: Disease-specific analysis empowered medical teams to focus on prevalent conditions such as CAD, hypertension, and diabetes, resulting in more effective disease management.
- Personalized Treatment Plans: The ability to analyse patient data based on ID and age facilitated the development of personalized treatment plans, optimizing patient care strategies.