Why Your Inbound Call Volume Is Overwhelming Your Team (And What Actually Fixes It)
Your call center metrics have been drifting in the wrong direction for six weeks. Agent occupancy is running past 90%. Abandonment rate has crept from 4% to 8%. Average speed of answer keeps ticking up. The team is exhausted. And every leadership conversation lands on the same conclusion: “We need to hire more agents.”
That conclusion is usually wrong.
High inbound call volume is almost never a headcount problem — it’s a diagnostic problem disguised as a headcount problem. Six specific sources feed inbound call volume, and each has a different structural fix. Teams that hire before diagnosing end up paying for calls that shouldn’t have been reaching them in the first place. This piece is the diagnostic that tells you what’s actually broken.
TL;DR
Your inbound call volume comes from six specific sources — not one. Digital experience failures, WISMO inquiries, product complexity, broken IVR routing, marketing-support expectation gaps, and genuine peak spikes. Only the last one is solved by hiring. The other five need structural fixes that are cheaper, faster, and more durable than adding headcount.
Most overwhelmed call centers staff up when they should be diagnosing. The average inbound call now costs $7.16 versus $0.40-$0.70 for AI-handled interactions — a 90-95% cost differential that changes the math on when hiring makes sense. This piece is the framework for finding out which sources dominate your queue, in what order to fix them, and when hiring or outsourcing actually is the right answer.
What Is Considered High Inbound Call Volume in 2026?
High volume isn’t defined by absolute call count — it’s defined by whether your operational metrics hold. Three thresholds tell you your team is structurally overwhelmed.
The industry-standard thresholds:
- Agent occupancy above 85% signals unsustainable workload and predicts burnout within 90 days
- Call abandonment rate above 6% means you’re actively losing customers before they reach a human
- Average speed of answer (ASA) beyond 28 seconds crosses the point where customer patience breaks
If two of these three thresholds are breached consistently, your center is structurally overwhelmed — regardless of how much headcount you’ve added. Adding more agents at this stage typically produces temporary relief that decays within 60 days because the underlying volume drivers haven’t been addressed.
Additional signals worth watching: agent turnover accelerating past 40% annually (national average sits at 30-45%, with some centers hitting 60%), first-year attrition reaching 65-70%, and QA scores drifting downward even though nothing about coaching has changed. All three are downstream effects of sustained overload.
What Does an Overwhelmed Call Center Actually Cost You?
The direct cost is easy to see — it’s the indirect costs that break the business case for adding more agents.
The three cost buckets to understand:
Direct cost per call. The average inbound call now runs $7.16 per interaction according to ContactBabel, 42% more expensive than a chat interaction. For a call center handling 30,000 calls per month, that’s $214,800/month in variable delivery cost — before considering hidden costs.
Cost of abandonment. 60% of callers hang up after 60 seconds on hold, and wait times over 5 minutes cause 40% of callers to abandon. Each abandoned call in commerce or subscription businesses represents $85-$300 in lost lifetime value depending on the vertical. A 10% abandonment rate on 30,000 monthly calls translates to $255K-$900K in monthly forfeit revenue.
Cost of agent turnover from overload. Replacing a single agent costs $10,000-$20,000 in recruitment, training, and lost productivity. At 40% annual turnover in a 50-agent center, that’s $200K-$400K per year — before considering the CSAT hit from new agents ramping.
Total cost of a 30,000-call-per-month operation running overwhelmed: $214K/month direct + $500K/month abandonment loss + $300K/year turnover = approximately $8.9M annually in cost you’d rather not have.
What Are the Real Symptoms of Call Volume Overload?
Four symptoms show up in exactly this order. If you’re seeing symptoms 3 or 4, you crossed the operational red line 60-90 days ago.
Symptom 1: Occupancy Climbing Above 85% Consistently
Your dashboard shows agents utilized 85%+ of their logged-in time. The occupancy metric feels good to management (agents are “productive”) but it’s the earliest warning of structural overload. Sustainable occupancy is 75-85% per SQM Group benchmarks. Above 85% means agents have no recovery time between calls, and quality starts degrading within weeks.
Symptom 2: Abandonment Rate Drifting from 4% to 6% to 8%
Abandonment is the customer voting with their feet. Industry-standard benchmark is 6%, best-in-class is 3% or lower. Watch the trend, not just the number — a rate creeping from 4% to 8% over three months is a slow-motion emergency even if the absolute number still looks “acceptable.”
Symptom 3: Rising Escalations and Callback Loops
Agents rush to close calls to reduce their queue. Complex cases get partial resolution. Customers call back to reach a different agent. First Call Resolution (FCR) drops from the 70%+ target to the 55-60% range. Each unresolved call becomes 2-3 future calls, compounding volume in a doom loop.
Symptom 4: CSAT Dropping Without Explanation
Product hasn’t changed. Pricing hasn’t changed. Shipping hasn’t changed. But CSAT has slipped 5-8 points month-over-month. This is the last-stage indicator — customers can feel the strain in every interaction and it’s showing up in the scores. By the time CSAT drops, you’ve been overloaded for 8-12 weeks.
Where Does Your Inbound Call Volume Actually Come From?
Every inbound call comes from one of six sources. Diagnosing the source ratio is what tells you whether the fix is technology, process, product, staffing, or all of the above.
Most teams treat inbound volume as a monolithic problem — “we’re getting too many calls.” That framing hides the actual leverage. Different call sources need different fixes, and hiring more agents solves exactly one of the six.
What Are the 6 Sources of Inbound Call Volume?
Understanding which sources dominate your queue is the highest-leverage diagnostic you can run.
Source 1: Digital Experience Failures
Customers call because your website, app, or checkout doesn’t answer their question or breaks their task. Common patterns: broken checkout, unclear pricing, missing product info, confusing account setup, no self-service order status. Gartner research shows 28% of customers who can’t find self-service will quit rather than call — the other 72% become inbound calls that shouldn’t exist.
The fix: UX audit of your top 10 customer journeys, self-service knowledge base, in-product help. This is a product problem, not a support problem.
Typical share of volume: 15-25%
Source 2: WISMO (“Where Is My Order?”) Inquiries
For any commerce business, “Where is my order?” and its variants dominate call volume. Customers want tracking updates, shipping timelines, delivery estimates. In D2C ecommerce, WISMO can represent 40-60% of inbound support volume, and these calls are almost entirely deflection-eligible.
The fix: Proactive shipping notifications, embedded tracking on the order confirmation page, automated status updates via SMS/email, and a well-designed self-service tracking portal. Companies that solve WISMO structurally see their call volume drop 30-50% within 90 days.
Typical share of volume (commerce): 30-50%
Source 3: Product Complexity
The customer can’t figure out how to use your product. This is common in SaaS, fintech, healthcare, and complex D2C categories. Onboarding is unclear, features are hard to discover, error messages are cryptic. Every call is a signal that documentation, in-product guidance, or the product itself needs work.
The fix: Better onboarding flows, in-app product tours (Pendo, Appcues, Chameleon), improved error messages, a searchable knowledge base, and video documentation. This is the most durable fix but the slowest to implement.
Typical share of volume: 10-20%
Source 4: Broken IVR and Routing
Customers get routed to the wrong department, dropped from queues, or trapped in IVR loops that don’t match their actual need. They hang up and call back — or reach the wrong agent and require transfers. Industry-standard call transfer rate is 15% or less; anything above 19% signals broken routing.
The fix: IVR audit, skill-based routing setup in your ACD (available in Genesys Cloud, Talkdesk, Five9, NICE CXone, Amazon Connect, Aircall, Zendesk Talk), callback queue implementation, and clearer menu structures. Also consider AI-powered voice routing (Sierra, Regal.io, Amazon Connect voice AI) which now costs $0.40-$0.70 per call.
Typical share of volume: 5-15%
Source 5: Marketing-Support Expectation Gaps
Marketing promises something the product doesn’t deliver, or the support team hasn’t been briefed on. Customers call because reality doesn’t match expectation. New feature launches, promotional campaigns, and policy changes are the usual culprits.
The fix: Cross-functional briefings 2 weeks before every campaign or launch, updated FAQ pages tied to marketing announcements, and a formal marketing-support alignment ritual. This is a governance fix, not a technology one.
Typical share of volume: 5-10%
Source 6: Genuine Peak Volume
Seasonal spikes (BFCM, Diwali, Singles’ Day, tax season, back-to-school), viral moments, and legitimate business growth. This is real, unavoidable volume that no amount of automation can deflect because the customers genuinely need human help right now.
The fix: Elastic capacity — either through cross-training internal teams, seasonal contractor hires, or an outsourced overflow partnership that scales up 40-100% for peak windows.
Typical share of volume: 10-25%
How Do You Diagnose Which Sources Dominate Your Queue?
A 60-minute audit tells you which of the six sources is eating your team. Skip this and you’ll fix the wrong thing.
The diagnostic is straightforward. Pull the last 500 inbound calls and categorize them by source:
- Source 1 flag words: “Your website says…”, “I can’t find…”, “The checkout won’t let me…”, “I can’t log in…”
- Source 2 flag words: “Where is my order?”, “When will it arrive?”, “The tracking says…”, “It’s been X days…”
- Source 3 flag words: “How do I…”, “Where in the app…”, “I don’t understand how…”, “The instructions…”
- Source 4 flag words: Anything that started with “I was transferred…” or “Your menu didn’t have…”
- Source 5 flag words: “Your ad said…”, “I thought this was included…”, “The promotion…”
- Source 6 flag: Was the call during a seasonal peak, campaign launch, or viral moment?
Score each of the 500 calls. Calculate the percentage. Whichever source represents more than 25% of volume is your #1 fix priority. If two sources are above 25%, fix them in parallel — they usually share root causes.
What Do Call Volume Sources Look Like by Industry?
Different industries have different source ratios. Recognizing your industry pattern accelerates the diagnostic.
If You Run a D2C Ecommerce Brand
Your ratio typically skews heavily toward Source 2 (WISMO at 40-60%) and Source 5 (marketing expectations at 10-15%) especially during promotional campaigns. Source 1 (digital experience) usually accounts for 10-15% around checkout friction. Focus your first 60 days on WISMO deflection through proactive comms and embedded tracking.
If You Run a B2B SaaS Company
Source 3 (product complexity) dominates at 30-50% — customers can’t figure out features, error messages are cryptic, or onboarding gaps show up as inbound calls. Source 4 (broken routing) often accounts for another 15-20% because SaaS support tiers get miscategorized. The fix stack is onboarding + in-app guidance + IVR audit.
If You Run a Healthcare or Telehealth Practice
Appointment scheduling and rescheduling dominate — patients make an average of 3.5 calls per scheduling need, and average healthcare hold time runs 4.4 minutes vs the 50-second target. Source 2 (patient-facing “where is my appointment” queries) and Source 1 (broken patient portal experiences) typically account for 60-70% of volume combined. Better patient portal UX plus proactive appointment reminders are the highest-leverage fixes.
If You Run a Fintech Startup
Source 3 (KYC/onboarding complexity) and Source 4 (routing failures around account verification) typically dominate. Regulatory constraints mean customers can’t always self-serve through onboarding, but better in-app status visibility (“Your ID verification is under review, estimated completion 24 hours”) deflects a meaningful share of check-in calls.
What Actually Fixes High Inbound Call Volume?
Five moves have the highest impact. Hiring more agents is the fifth, not the first.
1. Fix the Top Source First
Whichever source dominates your queue is where 50-70% of your available leverage lives. WISMO-heavy brands should invest in proactive shipping notifications before doing anything else. Product-complexity-heavy SaaS should invest in onboarding before hiring L1 agents. This is the single highest-leverage move a CX leader can make.
2. Deploy AI Voice for Routine Deflection
Voice AI has crossed the quality threshold in 2026. Amazon Connect, Google Contact Center AI, Sierra, and Regal.io now handle routine calls at $0.40-$0.70 per interaction versus $7.16 for human agents. For WISMO, password resets, order modifications, and appointment scheduling, AI voice handles 60-80% of the interaction without human involvement — and customers rate these interactions comparably to human agents on CSAT.
3. Redesign the IVR and Enable Callback Queues
Most IVRs are 5+ years old and haven’t been audited against current call reasons. Redesigning the menu with your current top-10 call reasons, adding skill-based routing in your ACD, and offering callback queues (available in Talkdesk, Five9, NICE CXone, Genesys Cloud, RingCentral) reclaims 15-25% of capacity from routing inefficiency alone.
4. Add Elastic Capacity for Peaks
If Source 6 (genuine peak volume) is meaningful for your business, elastic capacity solves it more efficiently than permanent hires. This can be seasonal contractors, cross-trained internal teams, or an outsourced overflow partnership structured for 6-10 week peak windows.
5. Only Then, Hire More Agents
If you’ve completed steps 1-4 and your queue is still overwhelmed with genuine human-necessary calls, hire. Not before. Teams that hire before diagnosing typically add 20-40% more headcount than they actually need, then quietly reduce it over the following 12 months as the structural fixes kick in.
When Should You Consider Outsourcing to Handle Volume?
Three specific scenarios where outsourced capacity solves the problem better than internal hiring.
Scenario 1: You’ve deflected everything you can, and you still need 20+ agents. If the residual human-necessary volume is real and sustained, outsourced dedicated agents deliver 40-70% cost savings versus in-house at comparable quality for most functions. This is the classic BPO use case.
Scenario 2: Your volume is heavily seasonal. If 40%+ of your annual revenue lands in a 6-10 week window (D2C during BFCM, tax season for accounting firms, back-to-school for education), permanent in-house hires are structurally uneconomic. Outsourced elastic capacity solves this cleaner than any internal model.
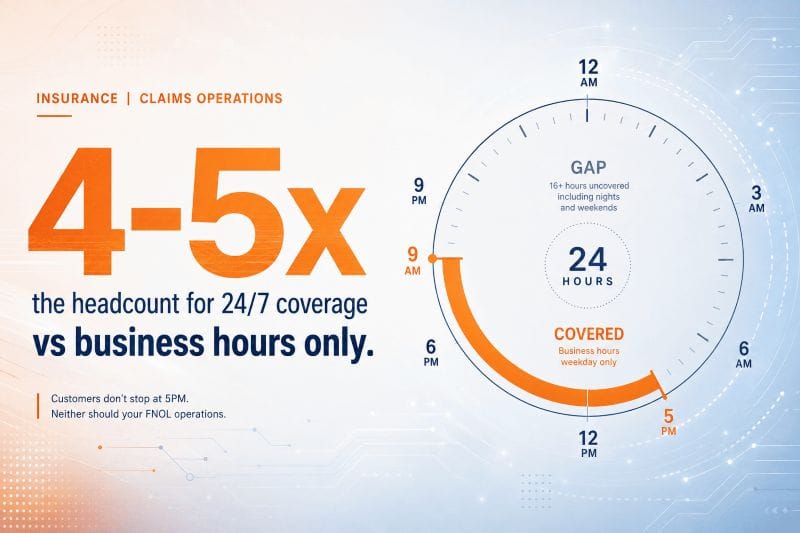
Scenario 3: You need 24/7 or extended-hours coverage. Round-the-clock coverage using in-house teams requires 4-4.5x baseline headcount (shift differentials, weekends, holidays). Offshore delivery in Bhubaneswar, Manila, or Bangalore covers US business hours as a natural night-shift overlap, delivering 24/7 capability at meaningfully lower blended cost.
If none of the three scenarios applies — if your volume is steady, your peaks are modest, and your business hours are limited — outsourcing may not be the right move. Better to invest in the deflection and process fixes first. See how to actually think about outsourcing inbound voice work for the deeper framework.
Frequently Asked Questions
What is the best live chat outsourcing service for ecommerce in 2026?
High volume is when your agent occupancy consistently runs above 85%, abandonment rate exceeds 6%, or average speed of answer (ASA) drifts past 28 seconds. Below those thresholds, staffing is adequate. Above them, your team is structurally overwhelmed regardless of headcount — you have a volume problem that hiring won’t fix.
Why is my inbound call volume so high?
Call volume comes from six specific sources: digital experience failures, WISMO (order tracking) inquiries, product complexity, broken IVR/routing, marketing-support expectation gaps, and genuine peak spikes. Most teams staff up when the real fix is source-specific: better self-service for source 1, proactive comms for source 2, onboarding for source 3, and so on. Hiring solves source 6 only.
How much does high call volume actually cost my business?
Direct cost: the average inbound call runs $7.16 per interaction (ContactBabel). Indirect costs are bigger — 60% of customers hang up after 60 seconds on hold, wait times over 5 minutes cause 40% to abandon (Sprinklr), and each abandoned call in commerce averages $85-$300 in lost lifetime value. Agent turnover from overload adds $10K-$20K per replacement.
What percentage of inbound calls can be automated in 2026?
Realistically, 30-50% of tier-1 volume in mature setups. Voice AI (Amazon Connect, Google Contact Center AI, Sierra, Regal.io) now costs $0.40-$0.70 per call vs $7.16 for human agents — a 90-95% reduction. Gartner projects 50% of contact center interactions will be automated by 2027, up from 10% in 2026 and 1.6% in 2023.
What’s the difference between call deflection and call reduction?
Call deflection routes calls to a non-human channel (IVR, chatbot, self-service portal) so a human agent doesn’t handle them. Call reduction removes the reason for the call in the first place — fixing broken checkout, improving product onboarding, or shipping proactive order updates. Reduction is more durable but slower to implement; deflection is faster but doesn’t fix the root cause.
How do I calculate whether my call center is understaffed?
Three metrics tell you: (1) Agent occupancy above 85% consistently = burnout risk and understaffed; (2) Abandonment rate above 6% = you’re losing calls; (3) ASA above 28 seconds = wait times are costing you customers. If two of three exceed these thresholds, you’re structurally understaffed — but hire only after you’ve diagnosed the volume source, or you’ll hire for calls that shouldn’t be reaching you.
When should I outsource my inbound call center?
Three scenarios: (1) You’ve deflected everything you can and still need 20+ agents just to handle residual volume; (2) You have predictable seasonal peaks (BFCM, Diwali, tax season) that make in-house hiring uneconomic; (3) You need 24/7 or extended-hours coverage that your in-house team can’t sustainably provide. Outsourcing before fixing the source of your volume just moves the problem to someone else’s queue.
The Bottom Line
High inbound call volume feels like a staffing problem because that’s how the dashboard presents it. Occupancy is high. Wait times are long. Agents are tired. The math seems simple: hire more people.
The math is misleading. Six specific sources feed your queue, and only one of them (genuine peak volume) is solved by hiring. The other five need structural fixes that are cheaper, faster, and more durable than adding headcount.
Diagnose your source ratio before you hire. Fix the top source first. Deploy AI voice for the routine 30-40%. Redesign your IVR. Add elastic capacity for peaks. If, after all of that, you still need more human capacity — that’s the moment to hire, or to explore how outsourced inbound voice support integrates with the fixes you’ve already made.
The teams that get inbound volume right in 2026 aren’t the ones with the biggest call centers. They’re the ones who did the diagnosis first, fixed the sources they could fix, and only added human capacity where humans actually create the value.